Your All-In-One Retail Analytics Solution
Acquire data like never before
Traffic

Passerby
Number of traffic pass by but not entering specific location

Zone Traffic
No. of people enter a user-defined zone from all direction

Footfall
Number of traffic
enter specific location

Engagement Count
No. of engaged people enter a user-defined zone from all direction

Dwell Time
Visitors’ average staying / browsing time

Engagement Time
Average time people who slow down or stop spend in user-defined zone

Queue Time
Average time spent at queuing zone

Emotion
Happy, neutral,
sad or angry

Gender
Average percentage
of female & male

Age Group
Average percentage
of different age group
Behavioral
Demographic

KPI Analysis
Review and compare the performance of your Sales, Traffic and Engagement with useful metrics widely adopted in the industries.

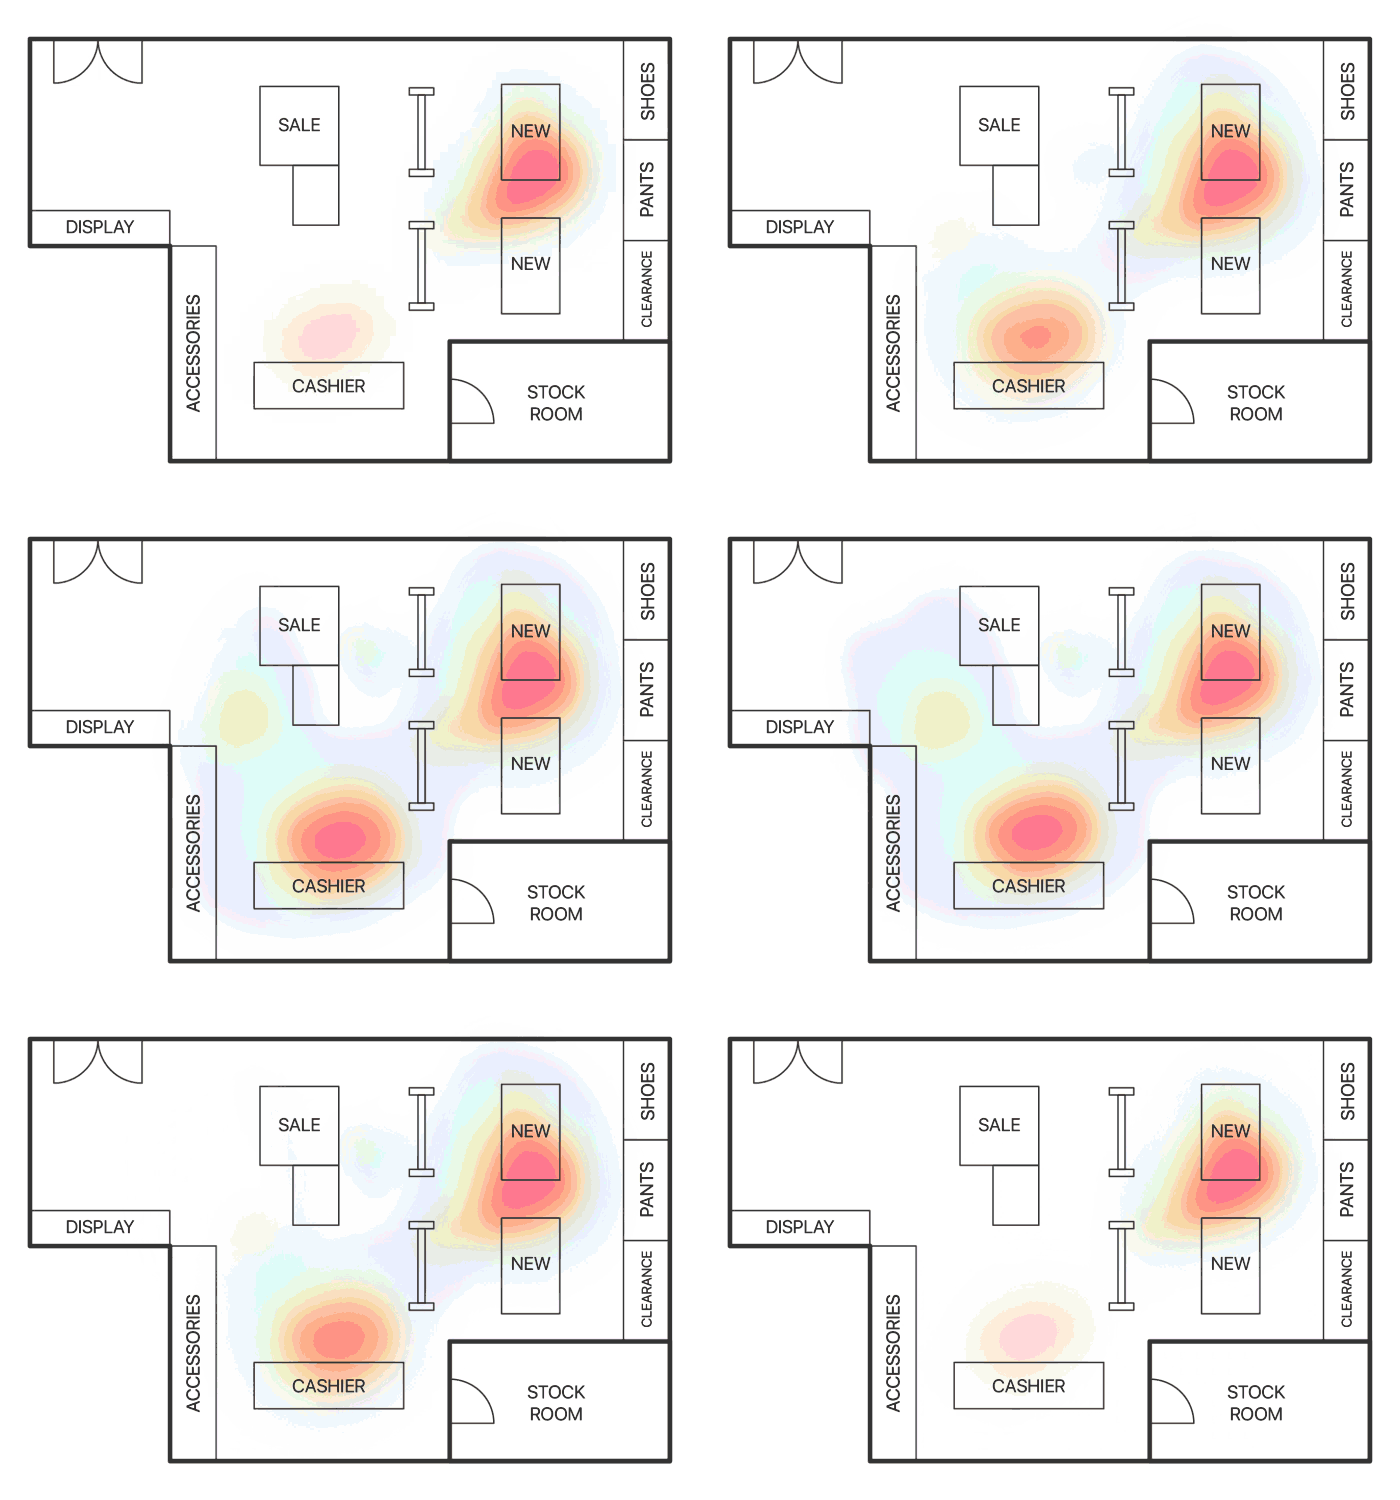
Heatmap Analysis
Heatmap indicates the amount of time the customers are spending at different parts of the store. The warmer colors refer to places where people linger and the cooler colored areas are the places where customers spend the least time at.


